WHO AM I?
We are all more than the sum of our parts, but the results below offer some of the most dramatic and fascinating information in your Geno 2.0 test. In this section, we display your affiliations with a set of nine world regions. This information is determined from your entire genome so we’re able to see both parents’ information, going back six generations. Your percentages reflect both recent influences and ancient genetic patterns in your DNA due to migrations as groups from different regions mixed over thousands of years. Your ancestors also mixed with ancient, now extinct hominid cousins like Neanderthals in Europe and the Middle East or the Denisovans in Asia. If you have a very mixed background, the pattern can get complicated quickly! Use the reference population matches below to help understand your particular result.
YOUR RESULTS
| NORTHEAST ASIAN | |
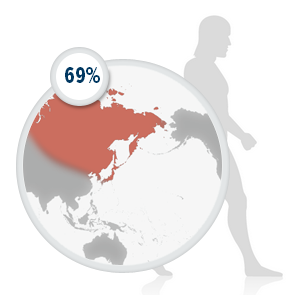 | This component of your ancestry is found at highest frequencies in the populations of northeast Asia—people from Japan, China and Mongolia in our reference populations. It is also found at lower frequencies in southeast Asia and India, where it likely arrived in the past 10,000 years with the expansion of rice farmers coming from further north. Interestingly, it is also found at a frequency of 5-10% in the Finns, likely introduced by the migrations of the Saami people from Siberia into Finland over the past 5,000 years. |
| SOUTHEAST ASIAN | |
 | This component of your ancestry is found at highest frequencies in the populations of southeast Asia and India, particularly in the northeast Indian and Vietnamese populations in our reference set. It is also found at lower frequency in populations from Oceania, where it persists as a signal of the Austronesian migrations into the region beginning ~5,000 years ago—a migration that would eventually colonize Polynesia. Interestingly, it is also found in the population of Madagascar, brought there by the seafaring Austronesians around 2,000 years ago. |
WHAT YOUR RESULTS MEAN
Modern day indigenous populations around the world carry particular blends of these regions. We compared your DNA results to the reference populations we currently have in our database and estimated which of these were most similar to you in terms of the genetic markers you carry. This doesn’t necessarily mean that you belong to these groups or are directly from these regions, but that these groups were a similar genetic match and can be used as a guide to help determine why you have a certain result. Remember, this is a mixture of both recent (past six generations) and ancient patterns established over thousands of years, so you may see surprising regional percentages. Read each of the population descriptions below to better interpret your particular result.
YOUR FIRST REFERENCE POPULATION: CHINESE
This reference population is based on samples collected from the population of Beijing, China. The 72% Northeast Asian and 28% Southeast Asian percentages are representative of migrations in East Asia, with the Northeast Asian component likely coming from the earliest settlers in eastern Siberia and northern China, and the Southeast Asian component reflecting mixing with groups that originated further south.
YOUR SECOND REFERENCE POPULATION: JAPANESE
This reference population is based on samples collected from the Japanese population. The 75% Northeast Asian and 25% Southeast Asian percentages are representative of migrations in East Asia, with the Northeast Asian component likely coming from the earliest settlers in eastern Siberia and northern China. The Southeast Asian component reflects mixing with groups that originated further south.
YOUR HOMINID ANCESTRY
 | When our ancestors first migrated out of Africa around 60,000 years ago, they were not alone. At that time, at least two other species of hominid cousins walked the Eurasian landmass: Neanderthals and Denisovans. Most non-Africans are about 2% Neanderthal. Indigenous sub-Saharan Africans have no Neanderthal DNA because their ancestors did not migrate through Eurasia. |
© 2005 - 2012 National Geographic Society. THE GENOGRAPHIC PROJECT, NATIONAL GEOGRAPHIC, and Yellow Border are trademarks of NGS. All rights reserved